
In part 1 you started a kind cluster, declared “three copies of nginx” and watched Kubernetes replace a Pod you deleted. This part opens the box. By the end you will be able to name every component of a cluster, say what each one does and where it runs, and follow a single kubectl apply from your terminal to a running container, using events and verbose logs as evidence. You need the kind cluster from part 1 (kind create cluster --name k8s-from-zero), kubectl v1.37 and about 30 minutes.
What you will build
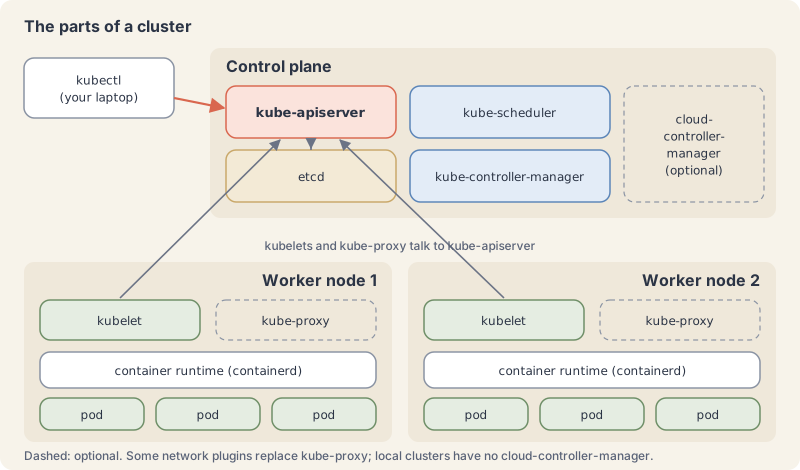
You will not build an app today. You will take a guided tour of a live cluster: list the control-plane components, find them as files and containers on the node, watch each component leave its fingerprint in the event log while a Deployment rolls out, peek into the database that stores it all, and then switch the scheduler off to see what breaks. The map below is the one to keep in your head for the rest of the series.
The control plane is the cluster’s brain
The architecture page splits a cluster into a control plane and a set of worker nodes. The control plane makes global decisions (for example, scheduling) and reacts to events (for example, starting a new Pod when a Deployment has too few). In production it usually runs on several machines for fault tolerance; in kind it all lives on one node. It has four core parts and one optional part:
- kube-apiserver is the front door. It exposes the Kubernetes HTTP API, checks who you are and whether you are allowed (controlling access), validates what you send and saves it. It is designed to scale horizontally: you can run several copies behind a load balancer.
- etcd is a consistent, highly available key-value store and the backing store for all cluster data. If etcd is lost without a backup, the cluster forgets everything it was told. Part 27 covers etcd backups.
- kube-scheduler watches for Pods that have no node yet and picks one for each. It weighs resource requests, hardware and policy constraints, affinity rules, data locality and more (scheduler page). It only decides; it does not start anything.
- kube-controller-manager runs the built-in controllers, the control loops from part 1. Each controller is logically separate, but they are compiled into one binary and run as one process. Examples: the Node controller (notices when nodes go down), the Job controller, the EndpointSlice controller, the ServiceAccount controller, and the Deployment and ReplicaSet controllers you will see in the lab.
- cloud-controller-manager (optional) links the cluster to a cloud provider’s API, for example to create a cloud load balancer. A cluster on your own laptop does not have one.
Nodes are where your containers run
Every worker node runs a small set of components (components page):
- kubelet is the node agent. It receives the Pods assigned to its node and makes sure their containers are running and healthy. It does not manage containers that Kubernetes did not create.
- A container runtime actually runs containers. The kubelet talks to it through the Container Runtime Interface (CRI), a gRPC API (CRI page), so the runtime is swappable. kind nodes use containerd.
- kube-proxy (optional) maintains network rules on the node so that Services (a stable address in front of a group of Pods, part 8) work. Some network plugins replace it with their own implementation.
On top of these sit add-ons, which run as ordinary Pods: cluster DNS (CoreDNS), the network plugin that gives every Pod an IP (kindnet in kind; part 61 explains network plugins), and in kind a small storage provisioner.
The one rule that ties all of this together: components never call each other. Each one talks only to the API server, mostly by watching it for changes and then writing back what it did. Only the API server reads and writes etcd.
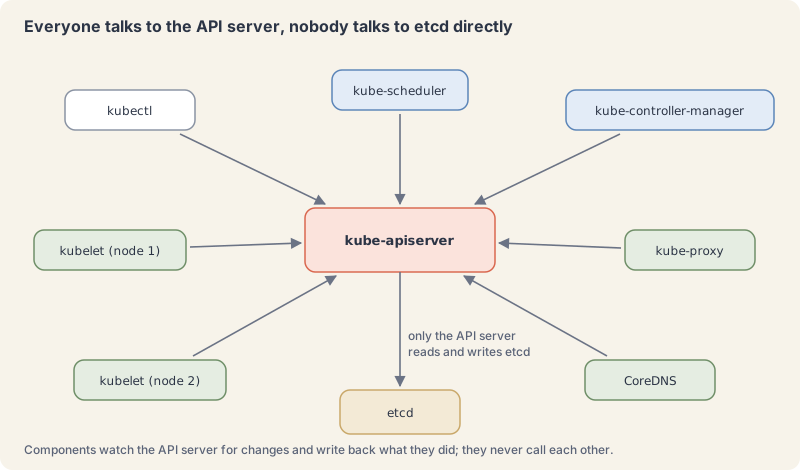
That design is why Kubernetes survives partial failures well. If the scheduler is down, nothing new gets a node, but everything already running keeps running. You will test exactly that.
Life of a kubectl apply
Here is what happens, in order, when you run kubectl apply -f web.yaml for a Deployment with two replicas. Each step is a separate component reacting to a change it saw through the API server.
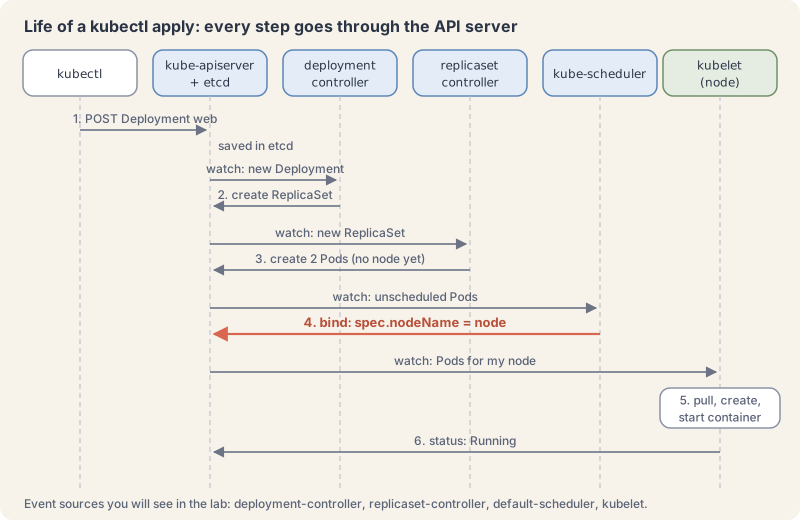
- kubectl reads your file, asks the API server whether a Deployment called
webexists, and since it does not, sends an HTTPPOST. The API server authenticates you, validates the object and stores it in etcd. - The Deployment controller (inside kube-controller-manager) is watching Deployments. It sees the new one and creates a ReplicaSet for it.
- The ReplicaSet controller sees a ReplicaSet that wants 2 Pods and has 0, so it creates two Pod objects. They exist only as records: no node, no container.
- The scheduler sees two Pods with an empty
spec.nodeName, scores the nodes and binds each Pod by writing a node name into it. - The kubelet on that node sees Pods assigned to it, asks containerd to pull the image (or finds it cached), create the container and start it.
- The kubelet reports the Pod’s status,
Running, back to the API server.kubectl get podsnow shows it.
Every arrow goes through the API server, and every step leaves an event you can read. Ownership is recorded too: each Pod carries an ownerReference to its ReplicaSet, and the ReplicaSet one to its Deployment (owners and dependents). That chain is how deleting a Deployment cleans up everything below it.
Try it: tour your own cluster
All commands below ran on our kind cluster k8s-from-zero. Names with random suffixes and port numbers will differ on yours.
1. Look at the node.
kubectl get nodes -o wideNAME STATUS ROLES AGE VERSION INTERNAL-IP ... OS-IMAGE KERNEL-VERSION CONTAINER-RUNTIME
k8s-from-zero-control-plane Ready control-plane 2m39s v1.37.0 172.18.0.2 ... Debian GNU/Linux 13 (trixie) 6.12.113+ (amd64) containerd://2.3.4CONTAINER-RUNTIME confirms containerd. Our single node is the control plane and also runs your workloads, which kind allows.
2. Find the control plane. The components run as Pods in the kube-system namespace (a namespace is a folder for objects; part 6 covers them):
kubectl get pods -n kube-system -o wideNAME READY STATUS RESTARTS AGE IP NODE ...
coredns-559f6c778d-m82pm 1/1 Running 0 2m29s 10.244.0.4 ...
coredns-559f6c778d-n6kz5 1/1 Running 0 2m29s 10.244.0.2 ...
etcd-k8s-from-zero-control-plane 1/1 Running 0 2m37s 172.18.0.2 ...
kindnet-hczvf 1/1 Running 0 2m29s 172.18.0.2 ...
kube-apiserver-k8s-from-zero-control-plane 1/1 Running 0 2m37s 172.18.0.2 ...
kube-controller-manager-k8s-from-zero-control-plane 1/1 Running 0 2m37s 172.18.0.2 ...
kube-proxy-t6cgl 1/1 Running 0 2m29s 172.18.0.2 ...
kube-scheduler-k8s-from-zero-control-plane 1/1 Running 0 2m37s 172.18.0.2 ...Everything from the map is here: etcd, kube-apiserver, kube-controller-manager and kube-scheduler (each with the node name as a suffix), plus kube-proxy, kindnet and CoreDNS.
3. See how the control plane starts. kind bootstraps each node with kubeadm, which runs the control-plane components as static Pods: Pod files that the kubelet reads straight from a folder on the node, without asking the API server (static Pods). A kind node is a Docker container, so you can look inside with docker exec:
docker exec k8s-from-zero-control-plane ls /etc/kubernetes/manifests
docker exec k8s-from-zero-control-plane systemctl is-active kubelet containerd
etcd.yaml
kube-apiserver.yaml
kube-controller-manager.yaml
kube-scheduler.yaml
active
activeThe kubelet and containerd are ordinary system services on the node. The four control-plane parts are files in a folder. Part 30 goes deeper into the kubelet.
4. Talk to the runtime directly. crictl is a debugging client for any CRI runtime:
docker exec k8s-from-zero-control-plane crictl psCONTAINER IMAGE CREATED STATE NAME ATTEMPT POD ID POD NAMESPACE
8210829884fa8 520212b8b0fcd 2 minutes ago Running coredns 0 b03643ff49a4e coredns-559f6c778d-m82pm kube-system
...
64b8dfaa414e7 270fbeb697171 2 minutes ago Running etcd 0 7b32bee57a197 etcd-k8s-from-zero-control-plane kube-system
9aedd1c85f871 364b3c3d9ec19 2 minutes ago Running kube-controller-manager 0 be8231196ab41 kube-controller-manager-k8s-from-zero-control-plane kube-system
541b0a5b9cd28 1fabf80a1273a 2 minutes ago Running kube-scheduler 0 a98ceb696a15a kube-scheduler-k8s-from-zero-control-plane kube-system
08f713ee1ecf4 bec5f0e1e2eeb 2 minutes ago Running kube-apiserver 0 d3e52fb566d4d kube-apiserver-k8s-from-zero-control-plane kube-systemSame components, seen from below: containers that containerd runs.
5. Ask the API server how it feels. It has health endpoints; /readyz?verbose lists every internal check:
kubectl get --raw='/readyz?verbose' | tail -3[+]poststarthook/apiservice-openapiv3-controller ok
[+]shutdown ok
readyz check passed6. See what the API offers. Every kind of object is an API resource:
kubectl api-resources | head -6NAME SHORTNAMES APIVERSION NAMESPACED KIND
bindings v1 true Binding
componentstatuses cs v1 false ComponentStatus
configmaps cm v1 true ConfigMap
endpoints ep v1 true Endpoints
events ev v1 true EventOur cluster listed 71 resource types (kubectl api-resources --no-headers | wc -l).
7. See who is in charge. In a cluster with several control-plane machines, only one scheduler and one controller manager act at a time; they hold a Lease object to prove it (leases):
kubectl get leases -n kube-systemNAME HOLDER AGE
apiserver-uwnlkcfd6lspuhs4nbdjmcuiy4 apiserver-uwnlkcfd6lspuhs4nbdjmcuiy4_8248f3ae-eac1-41ac-af27-67f6b0cfba7b 2m39s
kube-controller-manager k8s-from-zero-control-plane_ccba66fc-e889-452c-b239-090af9dc7a32 2m36s
kube-scheduler k8s-from-zero-control-plane_4a40fecb-4367-4589-8f16-70f0c542327b 2m35s8. Follow one apply. Save this as web.yaml:
apiVersion: apps/v1
kind: Deployment
metadata:
  name: web
  labels:
    app.kubernetes.io/name: web
spec:
  replicas: 2
  selector:
    matchLabels:
      app.kubernetes.io/name: web
  template:
    metadata:
      labels:
        app.kubernetes.io/name: web
    spec:
      containers:
        - name: nginx
          image: nginx:1.29-alpine
          ports:
            - containerPort: 80
In a second terminal, start watching events before you apply, so you see them in the order they happen:
kubectl get events --watch-only -o custom-columns=FROM:.source.component,REASON:.reason,KIND:.involvedObject.kind,NAME:.involvedObject.nameThen, in the first terminal, apply with -v=6, which makes kubectl log every API request it sends with its response code (we cut the log prefix from each line):
kubectl apply -f web.yaml -v=6 2>&1 | grep 'verb='"Response" verb="GET" url="https://127.0.0.1:45267/openapi/v3?timeout=32s" status="200 OK" milliseconds=4
"Response" verb="GET" url="https://127.0.0.1:45267/openapi/v3/apis/apps/v1?...&timeout=32s" status="200 OK" milliseconds=1
"Response" verb="GET" url="https://127.0.0.1:45267/apis/apps/v1/namespaces/default/deployments/web" status="404 Not Found" milliseconds=2
"Response" verb="POST" url="https://127.0.0.1:45267/apis/apps/v1/namespaces/default/deployments?fieldManager=kubectl-client-side-apply&fieldValidation=Strict" status="201 Created" milliseconds=4That is step 1 of the sequence in plain HTTP: kubectl fetched the API schema, checked for an existing web (404), then created it (201 Created). The second terminal shows steps 2 to 6:
FROM      REASON   KIND   NAME
deployment-controller   ScalingReplicaSet   Deployment   web
replicaset-controller   SuccessfulCreate    ReplicaSet   web-69977c9c79
replicaset-controller   SuccessfulCreate    ReplicaSet   web-69977c9c79
default-scheduler       Scheduled           Pod          web-69977c9c79-pwjwm
default-scheduler       Scheduled           Pod          web-69977c9c79-vfjt9
kubelet                 Pulled              Pod          web-69977c9c79-vfjt9
kubelet                 Pulled              Pod          web-69977c9c79-pwjwm
kubelet                 Created             Pod          web-69977c9c79-vfjt9
kubelet                 Created             Pod          web-69977c9c79-pwjwm
kubelet                 Started             Pod          web-69977c9c79-vfjt9
kubelet                 Started             Pod          web-69977c9c79-pwjwm
Read it top to bottom: the Deployment controller scaled up a ReplicaSet, the ReplicaSet controller created two Pods, the scheduler placed them, and the kubelet pulled, created and started each container. Press Ctrl+C to stop the watch.
9. Check the ownership chain and the binding. Use one of your Pod names:
kubectl get pod web-69977c9c79-sv68d -o jsonpath='{.spec.nodeName}{"\n"}{.metadata.ownerReferences[0].kind}/{.metadata.ownerReferences[0].name}{"\n"}'
kubectl get replicaset -l app.kubernetes.io/name=web -o jsonpath='{.items[0].metadata.ownerReferences[0].kind}/{.items[0].metadata.ownerReferences[0].name}{"\n"}'
k8s-from-zero-control-plane
ReplicaSet/web-69977c9c79
Deployment/webspec.nodeName is the field the scheduler wrote. The Pod is owned by the ReplicaSet, which is owned by the Deployment.
10. Peek into etcd. This is for learning only; in real life you never touch etcd by hand. The etcd Pod includes etcdctl, and the certificate paths are kubeadm’s defaults:
kubectl -n kube-system exec etcd-k8s-from-zero-control-plane -- etcdctl \
  --endpoints=https://127.0.0.1:2379 \
  --cacert=/etc/kubernetes/pki/etcd/ca.crt \
  --cert=/etc/kubernetes/pki/etcd/server.crt \
  --key=/etc/kubernetes/pki/etcd/server.key \
get /registry/deployments/default/web --keys-only/registry/deployments/default/webYour Deployment is a key in etcd, written there by the API server.
11. Switch the scheduler off. Because the scheduler is a static Pod, moving its file out of the manifests folder makes the kubelet stop it. Then ask for two more replicas:
docker exec k8s-from-zero-control-plane mv /etc/kubernetes/manifests/kube-scheduler.yaml /root/
kubectl get pods -n kube-system -l component=kube-scheduler
kubectl scale deployment web --replicas=4
kubectl get pods -l app.kubernetes.io/name=web
No resources found in kube-system namespace.
deployment.apps/web scaled
NAME READY STATUS RESTARTS AGE
web-69977c9c79-pjmll 0/1 Pending 0 10s
web-69977c9c79-pwjwm 1/1 Running 0 50s
web-69977c9c79-qd4cv 0/1 Pending 0 10s
web-69977c9c79-vfjt9 1/1 Running 0 50sThe controllers still did their part: the two new Pods exist. Nobody gave them a node, so they wait in Pending, and the two old Pods keep serving. kubectl describe on a new Pod shows Node: <none> and no events at all. Put the file back and the scheduler catches up:
docker exec k8s-from-zero-control-plane mv /root/kube-scheduler.yaml /etc/kubernetes/manifests/
kubectl get pods -l app.kubernetes.io/name=web
NAME READY STATUS RESTARTS AGE
web-69977c9c79-pjmll 1/1 Running 0 35s
web-69977c9c79-pwjwm 1/1 Running 0 75s
web-69977c9c79-qd4cv 1/1 Running 0 35s
web-69977c9c79-vfjt9 1/1 Running 0 75s12. Clean up.
kubectl delete -f web.yamlKeep the cluster for part 3, or remove it with kind delete cluster --name k8s-from-zero. As in part 1, our lab had no internet route inside the cluster, so we preloaded nginx:1.29-alpine with kind load docker-image; you do not need to.
When it goes wrong
Pods stay Pending with no events. Nothing scheduled them. Check that the scheduler runs: kubectl get pods -n kube-system -l component=kube-scheduler. If it does, kubectl describe pod usually shows a FailedScheduling event with the reason, such as not enough CPU; part 17 covers scheduling.
A node turns NotReady. Its kubelet stopped reporting. We stopped the kubelet with docker exec k8s-from-zero-control-plane systemctl stop kubelet; 47 seconds later:
NAME                          STATUS     ROLES           AGE   VERSION
k8s-from-zero-control-plane   NotReady   control-plane   28m   v1.37.0
kubectl describe node showed every condition as Unknown with the message Kubelet stopped posting node status. Containers that were already running kept running, which is why kubectl still worked. systemctl start kubelet brought the node back to Ready within 15 seconds. On a real node, check the kubelet’s service and logs (journalctl -u kubelet) and the machine itself. The nodes page explains heartbeats.
The connection to the server ... was refused. kubectl cannot reach the API server: the cluster is stopped, or kubectl points at the wrong cluster. Part 3 shows how kubectl decides where to connect.
You want to know what kubectl is really doing. Add -v=6 to any command to see each request and its response code; -v=8 also shows the request contents (kubectl quick reference).
Cheat sheet
| Task | Command or field | Note |
|---|---|---|
| Nodes with runtime and IP | kubectl get nodes -o wide |
CONTAINER-RUNTIME column |
| Control-plane and add-on Pods | kubectl get pods -n kube-system |
names end in the node name for static Pods |
| Static Pod files on a kubeadm node | /etc/kubernetes/manifests/ |
the kubelet runs whatever is here |
| Containers as the runtime sees them | crictl ps (on the node) |
in kind: docker exec <node> crictl ps |
| API server health | kubectl get --raw='/readyz?verbose' |
also /livez |
| All resource types | kubectl api-resources |
shows short names and API groups |
| Who leads the scheduler and controllers | kubectl get leases -n kube-system |
one holder at a time |
| Watch events as they happen | kubectl get events --watch-only |
add -o custom-columns=... |
| See kubectl’s HTTP calls | kubectl <command> -v=6 |
-v=8 adds request contents |
| Which node a Pod landed on | .spec.nodeName |
written by the scheduler |
| Who owns an object | .metadata.ownerReferences |
Pod to ReplicaSet to Deployment |
| Why a node is unhappy | kubectl describe node <name> |
read Conditions |
# The fields each component writes on a running Pod (trimmed)
apiVersion: v1
kind: Pod
metadata:
  name: web-69977c9c79-sv68d
  ownerReferences:                 # set by the replicaset controller
    - kind: ReplicaSet
      name: web-69977c9c79
spec:
  nodeName: k8s-from-zero-control-plane   # set by the scheduler
status:
  phase: Running                   # reported by the kubelet
Recap and what is next
- The control plane is kube-apiserver, etcd, kube-scheduler, kube-controller-manager and, in clouds, cloud-controller-manager.
- Every node runs a kubelet and a container runtime (containerd here), and usually kube-proxy; DNS and networking come as add-ons.
- Every component talks only to the API server, and only the API server talks to etcd.
- One
kubectl applybecomes a chain: Deployment, ReplicaSet, Pods, a scheduler binding, a kubelet start. Events and-v=6let you watch it. - When one component stops, only its job stops: no scheduler means new Pods wait, and running Pods keep running.
Next: part 3, your local lab, where you install kubectl and kind properly, compare them with minikube, k3d and Docker Desktop, and learn how kubeconfig and contexts decide which cluster you are talking to. Coming tomorrow.
The Campfire
CommentsThanks. Your comment is waiting for the desk. Once it is approved it appears here within about a minute.
Add a comment